The last three years with Covid-19 and lockdowns has profoundly impacted all walks of life. On the railways this appears to have fundamentally shifted passenger demand, with the Office Rail and Road noting that the annual number of journeys has yet to recover to pre-pandemic levels.
Our client wanted to understand how these changes may impact current and future geographical demand for rail passenger mobile connectivity. With a choice of technical interventions – ranging from addressing “not-spots” only, through to dedicated infrastructure solutions – establishing the baseline requirements is an important first step in the development of policy.
ORR and annual station passenger estimates
The ORR [1] publishes annually their estimate of passenger rail usage by station including entries, exits and interchanges (“Table 1410”). Their latest publication notes that 990 million passenger journeys were made through the 2,570 GB railway stations. This is more than double the 388m journeys made in the previous year, but still lower than the pre-pandemic 1,739m journeys made between April 2019 and March 2020.
The data provides details of how many passengers enter and exit stations, but not by which route they then travel. Separately, the Rail Delivery Group regularly publish timetable data[2] – though in a particular format geared for rail industry use – giving details of trains, routes, and stations called at.
Our task was to see if through combining these sources of data we could estimate rail passenger flows (demand), and hence determine appropriate technology interventions.
Modelling the network
Building on work by ITRC (ITRC – The Infrastructure Transitions Research Consortium) we adapted Python code[3] to build a topological model of the GB railway network including routes and stations.
The first step involves estimating the number of trips generated and attracted at all individual stations on the network (from the ORR data) and converting these into typical daily estimates in proportion to the train frequencies for that day (using the timetable data). In estimating the trip distribution across a week, we calculated the daily number of trains at each station as being a combination of the number of trains starting (passengers only enter), making intermediate stops (passengers enter and exit and possible interchange) or terminating (passengers only exit) at the station. And since the breakdown between the number of entries and exits is not available, we assumed a 50:50 distribution.
The second step involves pairing total trip origin and destination information to create an origin-destination (O-D) matrix and allocating trips to the rail network routes. The aggregate daily station usage figures (in effect the nodes on the graph) are converted to flows along specific paths (the edges). The O-D flows are obviously static estimates for the average daily flows through the railway network. As such they do not consider seasonal variations or network disruptions, but we believe they provide a reasonable approximation for the purposes of identifying typical demand.
The calculation of the blended weekday average number of passengers per train is then simply the sum of passengers travelling in both directions between pairs of nodes along individual edges, divided by the number of trains. We ignore directionality where at certain times of day trains in one direction may be more heavily loaded (such as during the morning rush hour on trains heading into a city) on the basis that over the course of day these bi-directional flows should balance.
To provide a comparison between years, we used timetable data for the third Wednesday of each September reflective of “normal” timetabled train services following the summer holidays.
Visualizing the data
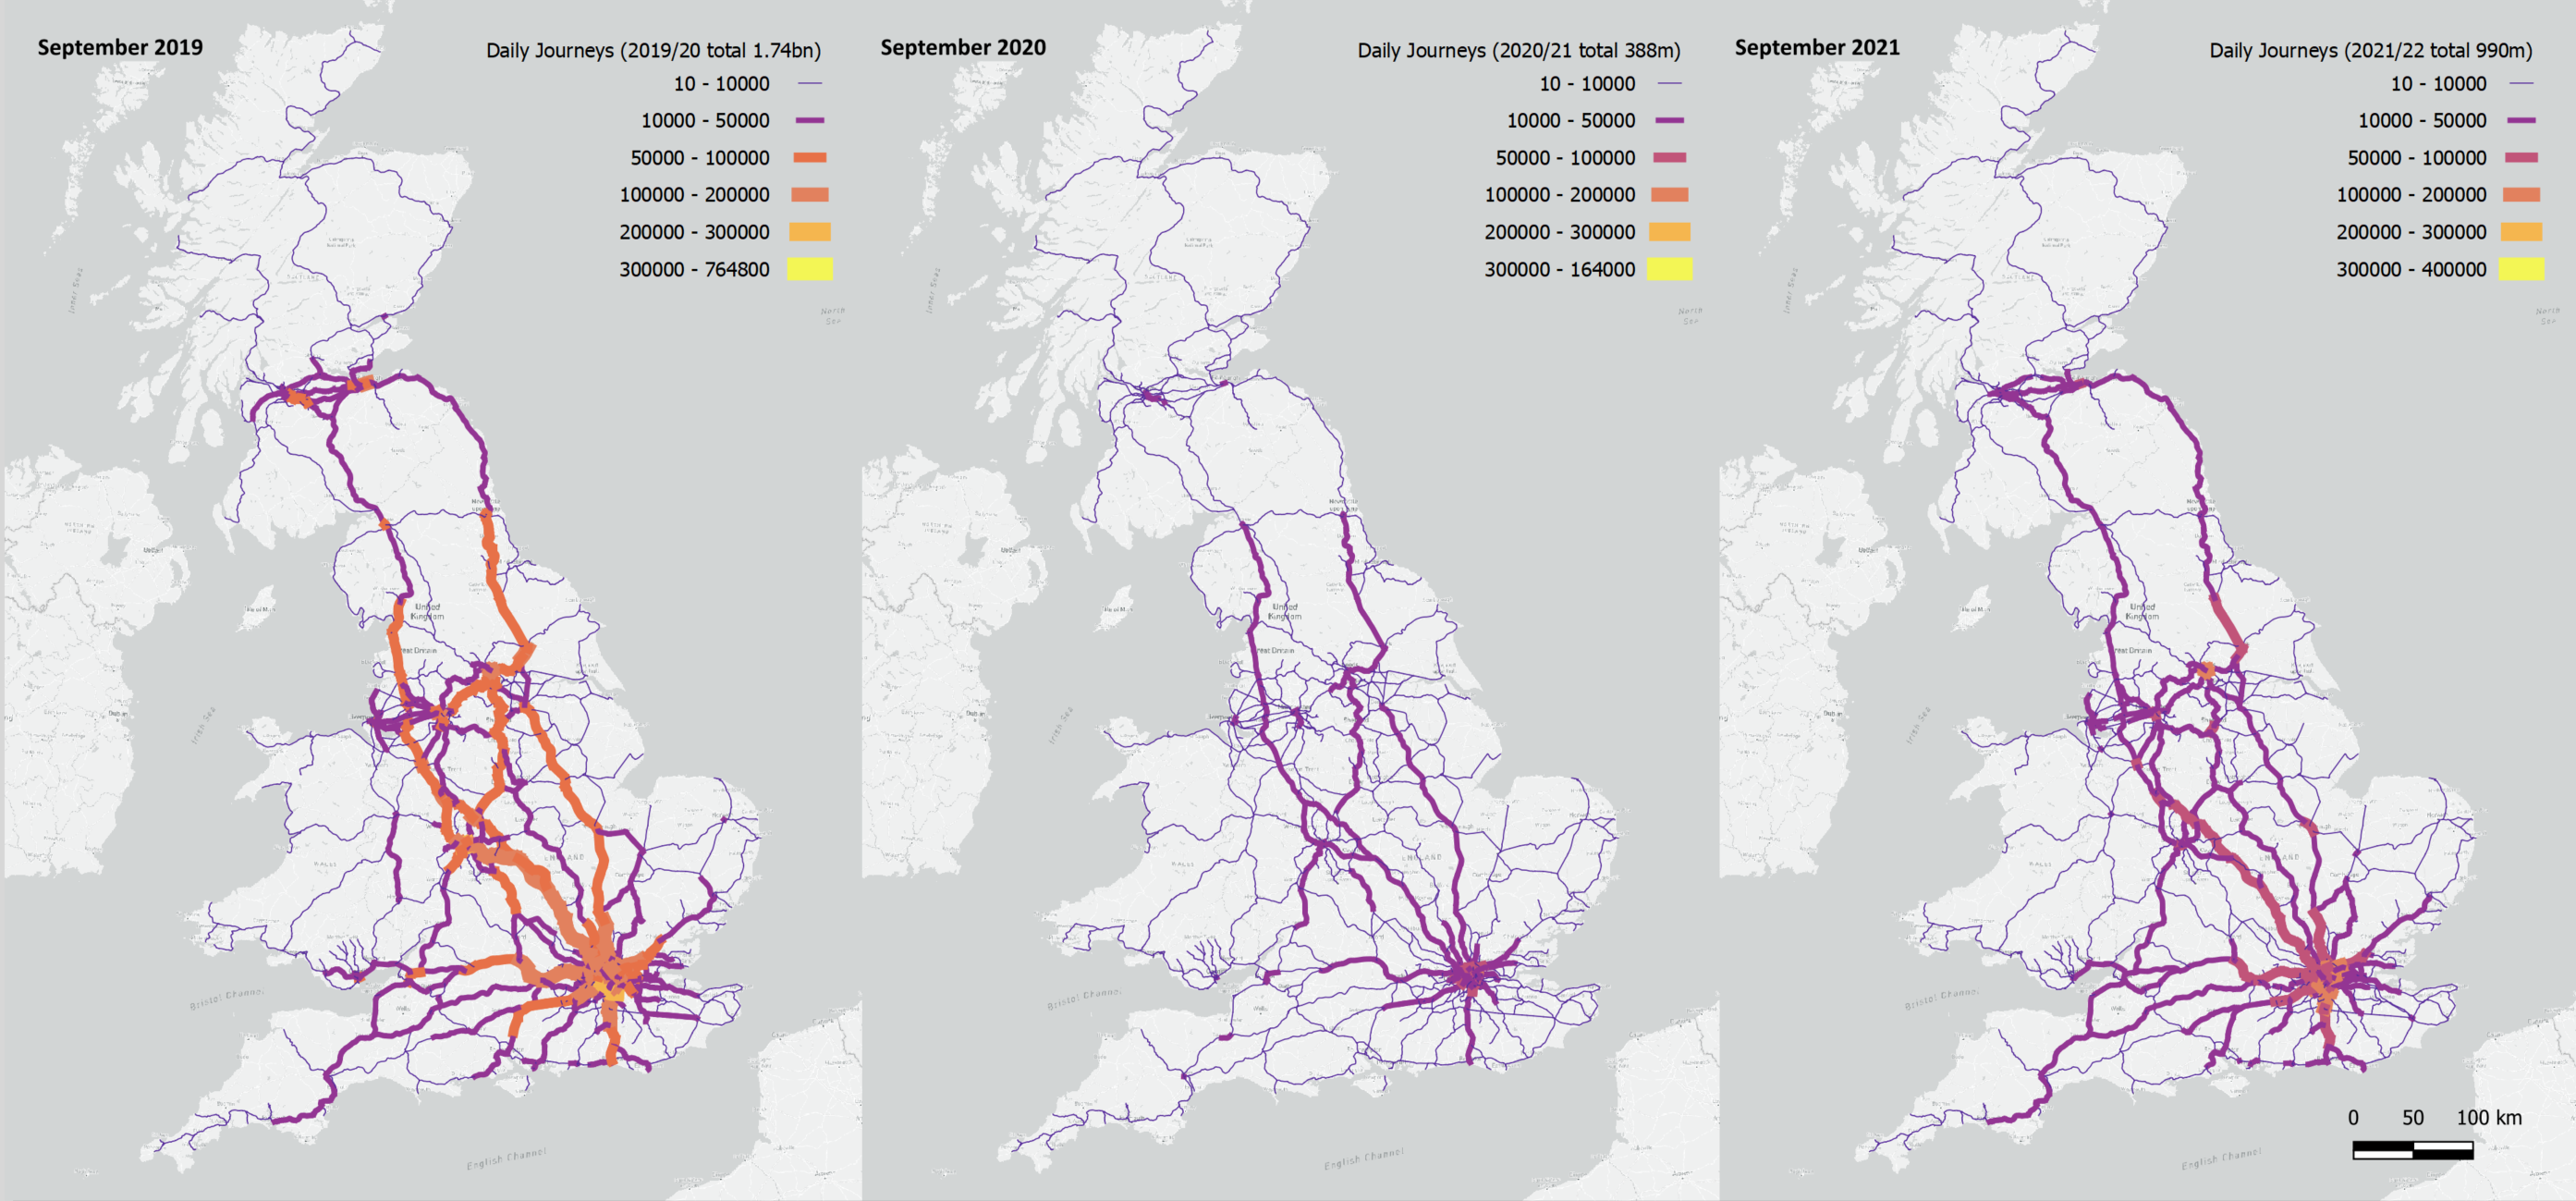
In aggregate, total rail journeys have changed significantly: from 1.74bn in 2019/20, to only 388m in 2020/21, rising again after restrictions were lifted to 990m in 2021. For comparison, London Waterloo had 86.9m entries and exits in 2019/20, only 12.2m the following year, and 41.4m in 2020/21.
These stark variances are clearly visible in the figure below. During the pandemic spanning the 2020/21 data, passenger flows changed significantly, with particularly noticeable falls in mainline journeys and those on south west, south Wales, northern England and cross-country routes.
What are the implications?
Using ORR passenger numbers from 2019/20 as a proxy for the eventual recovery of rail passenger journeys, it is useful to look at the average number of passengers per train, and separately the kilometres of railways these trains run over to estimate demand by route section.
Looking just at trains that ran on Wednesday 19 September 2019, it is possible to see a “long tail” distribution, with many trains carrying on average few passengers.
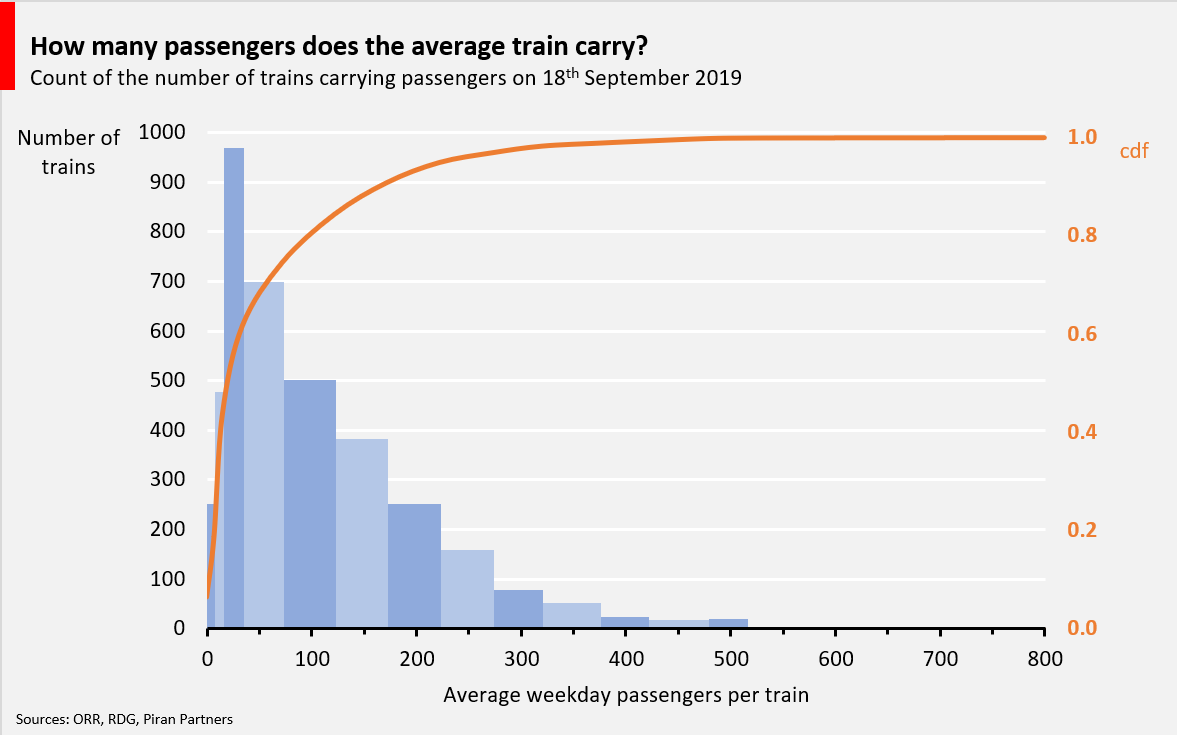
Ignoring that there are distinct busy periods each day, this blended daily average train demand sets a baseline for traffic engineering. To note, the average (not peak) number of passengers on rush hour trains can be (or at least used to be) three to four-times higher.
What is then interesting is how many kilometres of rail routes have such demand.
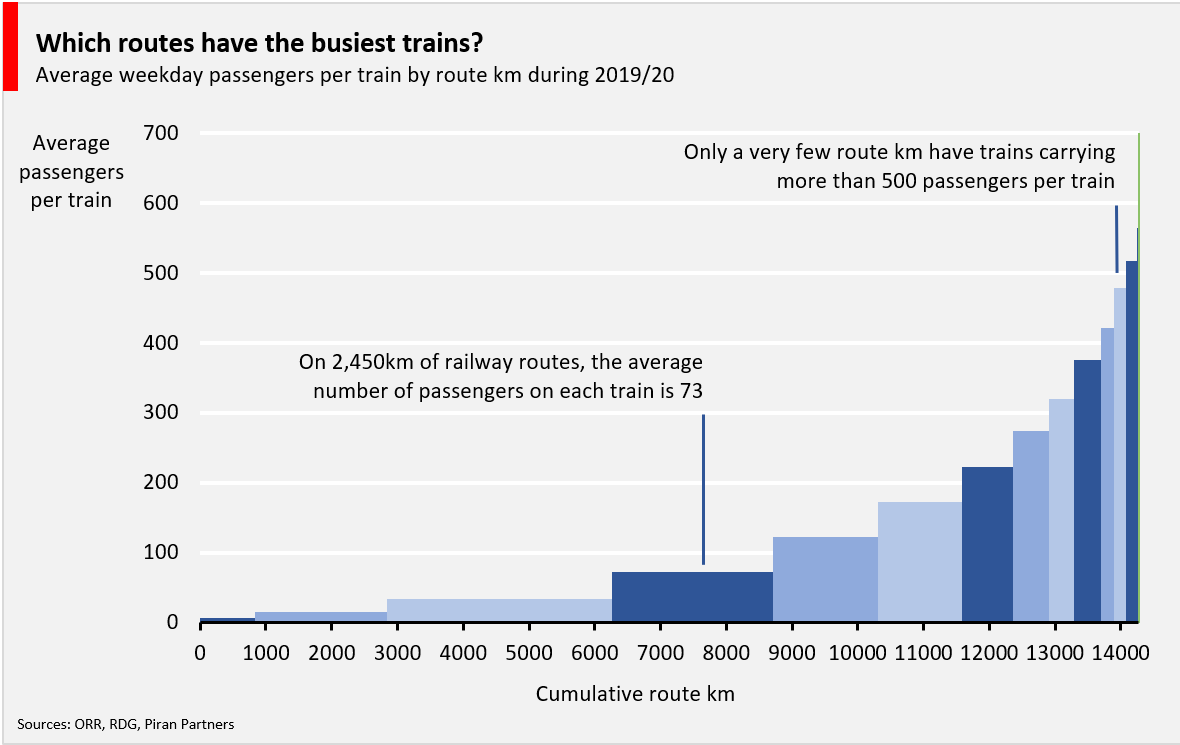
The chart shows that approximately 80% of total routes by distance (11,600km) carry less than 175 passengers per weekday train on average. So, depending on assumptions of what data throughput is required per passenger, aggregate demand per train per route section can be calculated.
| Data throughput per passenger (Mbps) | Aggregate train demand (Mbps at 4:1 contention) |
| 2 | 110 |
| 5 | 275 |
| 10 | 550 |
As noted, these calculations do not consider peak hour demand, nor the different trains the train operators might run on the same track, nor – depending on the choice of technology – whether multiple trains may be within the same radio cell. All of which will increase aggregate demand by a factor of two or three.
For cellular solutions, where the aggregate demand is shared between mobile operators, even these current needs can mean their 4G services quickly become congested. Add in rail coverage “not spots”, other customers being served in the surrounding area, and that networks are not generally aligned to serve the railways, it is hardly surprising that mobile data connectivity is poor.
For the 10% of busiest routes (1,400km), with an average of 400 passengers per train (range 320 – 800), demand is naturally higher. Realistically 5G-type services, aggregating spectrum at 3.5GHz and above, and potentially coupled with dedicated infrastructure, will be needed.
| Data throughput per passenger (Mbps) | Aggregate train demand (Mbps at 4:1 contention) |
| 2 | 200 |
| 5 | 500 |
| 10 | 1,000 |
Where on-train wifi solutions are used to distribute data connectivity to all passengers, the challenge is even greater. Delivering 1Gbps-plus per train requires 100-200MHz of bandwidth depending on spectral efficiency. This is increasingly the realm of dedicated millimetric wave solutions.
Outcomes
Ironically anyone travelling during the pandemic (assuming they could) would probably have experienced better on-train wifi and mobile connectivity, since aggregate demand would have been significantly reduced, especially as the number of timetabled trains did not significantly change.
The toolset adapted by Piran allows route-by-route analysis to be undertaken, clearly establishing that a “one-size-fits-all” approach is not appropriate.
Interventions need to consider the route demand and desired passenger experience. Passengers on long-distance mainline services probably want higher data speeds for work and leisure, but there are often less people on such trains outside of peak hours. On routes heading to and from cities and commuter routes, high demand will require 5G and millimetric solutions.
For more information, please contact Piran Partners LLP.
[1] Home page | Office of Rail and Road (orr.gov.uk)
[2] Rail Industry Data | data.atoc.org
[3] GitHub – itrcrisks/GB-railway-network-model: A model of the Great Britain railway network with topology and flows