We all know how poor mobile phone connections, and the on-train wifi that relies on these too, can be when travelling by train.
Apart from the obvious signal blockers like deep cuttings and tunnels, trains run through rural areas with few villages, towns or roads and hence little incidental mobile coverage. Add in busy trains (at least pre-pandemic), carrying the equivalent of a small village worth of people all attempting to connect to their nearest mobile operator’s cellular basestation, and its unsurprising that Transport Focus [1] found that passengers only receive a good 4G connection some 58 per cent of the time.
Connected Nations and railway 4G signal measurements
In 2019 Ofcom published their annual Connected Nations report [2]. For the first time this included signal strength measurements of the four mobile operators across most of Great Britain’s railways.
This work was commissioned by our client the Department of Transport. The aim? To help quantify the issues and challenge the rail and telecom industries to improve services for rail passengers.
Signal measurements of the mobile operators’ 2G, 3G and 4G services at different carrier frequencies were recorded over the course of a year as four of Network Rail’s maintenance trains travelled the country. Metrics include calibrated 4G RSRP, RSRQ and SNIR measured at train roof-top height.
Over the last year Piran has undertaken detailed spatial analysis of this Ofcom and other datasets.
Visualizing the data
Visualizing any big data set is always a challenge, especially as the maintenance trains have recorded data at similar locations many times throughout the year.
Enter Uber’s H3 geospatial index [3]. This was developed by Uber to help with their data science needs. H3 tessellates the world into hexagonal cells mapping latitude / longitude co-ordinates to the appropriate H3 cell. Cell sizes can range from the huge (1,100km per edge) to the small (0.5m per edge).
By taking the geometric mean of each mobile operator’s recorded signal to noise and interference ratio (SNIR) – used as a proxy for the likely data speed a passenger’s device might get – in each H3 cell, patterns in the data are more easily seen.
The choice of cell edge of about 1.2km, representing an area of about 5.2km2, also happens to correspond nicely with a typical macro 4G cellular basestation’s range.
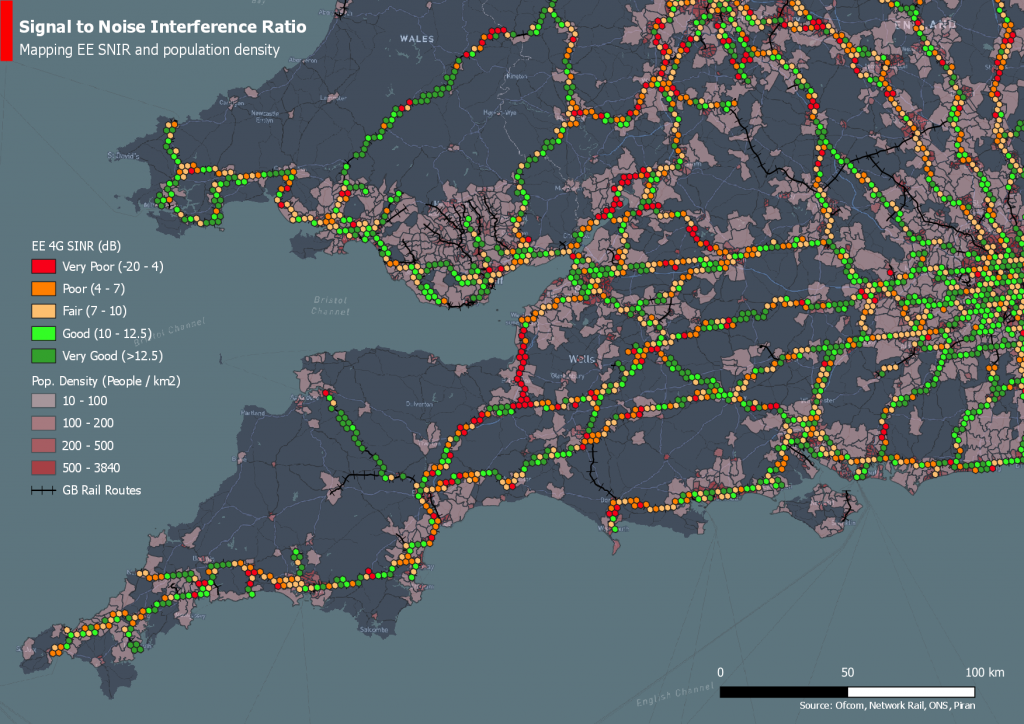
Five ranges for SNIR are shown in the map extract of south western England and Wales. These bands, whilst subjective, reflect the ‘quality’ of the signal ranging from ‘very good’ quality (SNIR > 12.5dB) to ‘very poor’ (SNIR < -4dB).
The year 2020 population density by electoral ward (those with more than 10 people per square km) is also shown for information too. Though the correlation is weak, higher SNIRs are, visually at least, found nearer more populated areas. Whilst red and amber locations are readily apparent.
Examining the data in detail
Looking just at EE’s information (though analysis has been undertaken for Vodafone, O2 and Three) about 50 per cent of hexagons (n=6,108) have an average SNIR greater than 10dB.
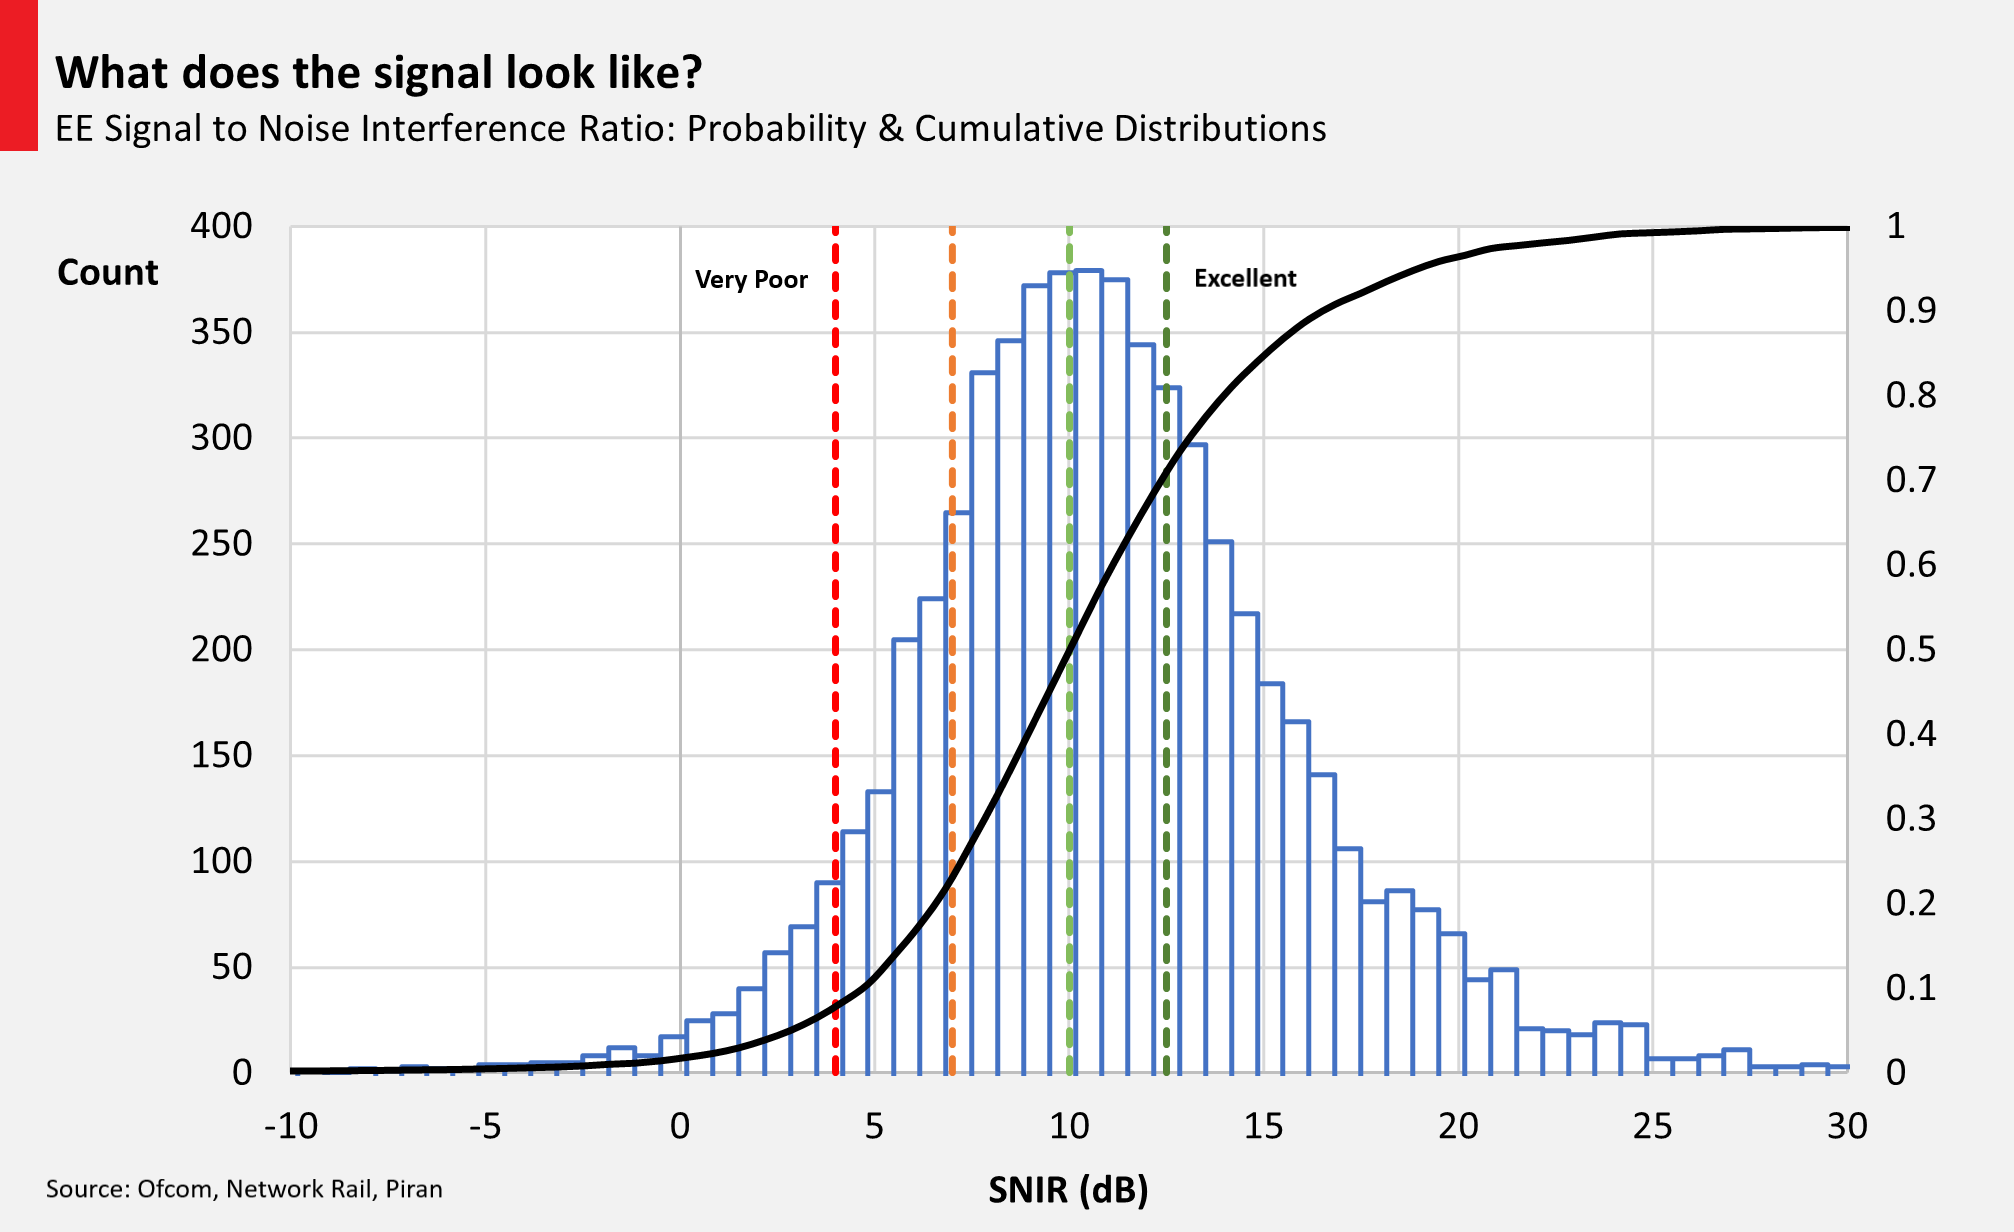
At SNIRs of 7dB and below, 4G data speeds and connections start to become intermittent – this affects 22 per cent of locations. Remember though that these measurements were conducted at train roof-top height, so the likelihood is that the signals received by passengers’ devices are worse.
Factors such as how many other passengers are travelling, and the train carriage design can dramatically reduce signals even further – anywhere from 3dB (a reduction by half in the actual power) to 30dB (a thousand-fold reduction).
Of course, rail passengers are not just EE customers. It’s the availability of all the mobile operators’ signals and the continuity of their services across a journey that’s important.
Here the analysis is mixed. Only in 38 per cent of cases (n=6,226) do all four mobile operators’ SNIRs in the same cell exceed 7dB. And even a quick glance of the map shows there are few contiguous stretches of consistently good signals.
| Mobile operator not-spots (Number of H3 hexagons where SNIR ≤ 7dB) | |||
| 0 | 2387 | 38% | all mobile operators SINR > 7 dB |
| 1 | 1575 | 25% | 1 mobile operator’s SINR < 7 dB |
| 2 | 1225 | 20% | 2 mobile operators’ SINR < 7 dB |
| 3 | 656 | 11% | 3 mobile operators’ SINR < 7 dB |
| 4 | 383 | 6% | all mobile operators’ SINR < 7 dB |
What are the implications?
One mobile network operator’s not-spot will be different to another’s, and will not always overlap. Providing contiguous good-quality signal for all passengers, regardless of their choice of provider, means addressing every mobile operator’s not-spots.
In Piran’s experience this requires commercial incentives, especially given the added complexity and cost of addressing the rail corridor. Mobile operators’ corporate strategies vary considerably, and rail connectivity is not usually a priority.
Even introducing third-party network infrastructure providers to build neutral host infrastructure (where new masts are shared between tenants) doesn’t make these fundamental commercial drivers disappear – though it helps lower the barriers.
In this respect the UK government’s free wifi on trains policy dating from 2015 has been a (qualified) success.
Train operators have needed to purchase large amounts of 4G data to serve the on-train gateways, which link passengers’ wifi-enabled devices with the internet. In return, some mobile operators have committed to addressing their not-spots.
A good example is the recent £45m multi-year deal between BT and Avanti West Coast where EE, BT’s mobile arm, will build new masts and re-align existing coverage to better serve the West Coast mainline between Manchester and Glasgow. Passengers using the on-train wifi, and passengers who are customers of EE, should see a better more consistent service.
Other countries’ approaches include introducing rail corridor-related mobile licence obligations like in France, or using the power of ‘persuasion’. Deutsche Telekom and Deutsche Bahn announced last year they will address the country’s 7,800km of high-speed lines by 2024 and all routes by 2026. The German Minister for Transport appeared at their joint press conference.
Experience suggests that improving rail corridor connectivity ultimately requires a mix of technical, regulatory and commercial levers with alignment between government, mobile operators and the rail infrastructure and train operators.
For more information please contact Piran Partners LLP
[1] Keeping connected: passengers’ experience of internet connectivity on Great Britain’s railways – Transport Focus
[2] Mobile signal strength measurement data from Network Rail’s engineering trains (ofcom.org.uk)